Daeil Aqua Co., Ltd. ---- Manufacturer of Industrial & HVAC Cooling Towers

Professional Engineeing Publication < HOME 

Professional Engineeing Publication


1) Tower Demand

Liechtenstein introduced the "Cooling Tower" equation in 1943 and he used Merkel theory in conjunction with differential and fundamental equations to define cooling tower boundary conditions. The resulting dimensionless groups related the variables for heat and mass transfer on the counter flow type tower. Liechtenstein determined by experimental testing that his equation did not fully account for the air mass rate or velocity. He also implies in the original paper that tests conducted at the University of California suggested a variation in the tower characteristic due to the inlet water temperature. A method is given for adjusting the tower characteristic for the effect. Several investigators have substantiated the effect of hot water temperature and air velocity on the counter flow tower.

The Merkel equation is used to calculate the thermal demand based on the design temperature and selected liquid-to-gas ratios (L/G). The value of KaV/L becomes a measure of the order of difficulty for the liquid cooling requirements. The design temperature and L/G relate the thermal demand to the MTD (Mean Temperature Difference) used in any heat transfer problem. As stated by Liechtenstein the use of his method required a laborious trial-and-error graphical integration solution for tower design. During his employment with the Foster-Wheeler Corporation, he published a limited edition of "Cooling Tower Black Book" in 1943. The tower demand calculations were incorporated into a volume of curves eliminating the need for tedious busy work. For many years the publication was the industry standard for evaluating and predicting the performance of tower.

A similar publication entitled "Counter Flow Cooling Tower Performance" was released during 1957 by J. F. Pritchard and Co. of California. The so-called "Brown Book" presented a change in format to a multi-cycle log plot. This format allows the cooling tower characteristic curves to be plotted as straight lines. The publication include cooling tower design data for various types of counter flow fill. Design procedures and factors affecting cooling tower selection and performance are discussed.

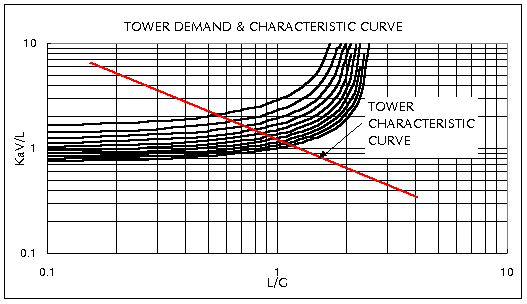
With the advent of the computer age the Cooling Tower Institute published the "Blue Book" entitled "Cooling Tower Performance Curves" in 1967. The availability and use of the computer allowed the Performance and Technology Committee to investigate several methods of numerical integration to solve the basic equation. The Tchebycheff method was selected as being of adequate consistency and accuracy for the proposed volume. The CTI curves were calculated and plotted by computer over a large span of temperature and operating conditions. The curves are plotted with the thermal demand, KaV/L as a function of the liquid-to-gas ratio, L/G. The approach lines (tw1 - WBT) are shown as parameters. The curves contain a set of 821 curves, giving the values of KaV/L for 40 wet bulb temperature, 21 cooling ranges and 35 approaches.

2) Tower Characteristic


An equation form used to analyze the thermal performance capability of a specified cooling tower was required. Currently, the following equation is widely accepted and is a very useful to be able to superimpose on each demand curve, since KaV/L vs. L/G relationship is a linear function on log-log demand curve.

KaV/L = C (L/G)-m

where,

KaV/L=Tower Characteristic, as determined by Merkel equation
C=Constant related to the cooling tower design, or the intercept of the characteristic curve at L/G=1.0
m=Exponent related to the cooling tower design (called slope), determined from the test data

The characteristic curve may be determined in one of the following three ways;


(1) If still applicable and available, the vendor supplied characteristic curve may be used. In all cases the slope of this curve can be taken as the slope of the operating curve.
(2) Determine by field testing one characteristic point and draw the characteristic curve through this point parallel to the original characteristic curve, or a line through this point with the proper slope (- 0.5 to - 0.8).
(3) Determine by field testing at least two characteristic points at different L/G ratios. The line through these two points is the characteristic curve. The slope of this line should fall within the expected range, and serves as a check on the accuracy of the measurement.

A characteristic point is experimentally determined by first measuring the wet bulb temperature, air discharge temperature, and cooling water inlet and outlet temperature. The L/G ratio is then calculated as follows;


(1) It may be safely assumed that the air discharge is saturated. Therefore, the air discharge is at its wet bulb. Knowing wet bulb temperature at the inlet of tower, the enthalpy increase of the air stream can be obtained from a psychrometric chart. Air and water flow rates have to be in the proper range for uniform flow distribution. In case of recirculation of the air discharge, the inlet wet bulb may be 1 or 2oF above the atmospheric wet bulb temperature.
(2) From a heat and mass balance the dry air rate and the prevailing L/G ratio in the tower can be calculated [L/G = D ha / (Cw x (tw2 - tw1))]

Next, the corresponding KaV/L value has to be established. This is simply done by plotting the calculated L/G and approach on the demand curve for the proper wet bulb and range.